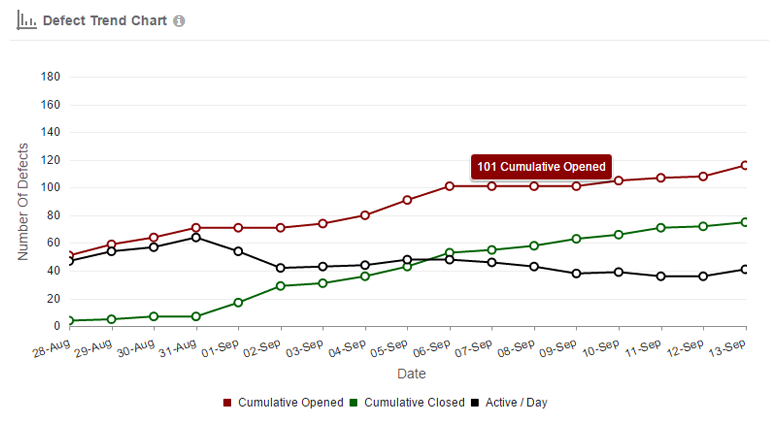
The Defect Trend chart shows the cumulative defects opened versus cumulative defects closed for the last 30 days.
X – Axis: Last 30 day from the current date.
Y – Axis: Number of Defects.
The decrease or increase in a trend shows the submission or resolved rate of the defects each day.
The chart shows the submission rate of defects and the rate at which it gets closed in a form of cumulative trend. The chart also shows the count of active defects for each days on X-Axis.
The shorter the distance between the Cumulative Opened (red line) and Cumulative Closed (green line) the efficient the team is, in terms of resolving defects. The higher the distance between the lines is a concern area for the team and should be analysed for the bottleneck if any.