Velocity is a capacity planning tool that can be used in agile software development. The velocity is calculated on the ground of the number of work units completed in a certain time period of fixed length.
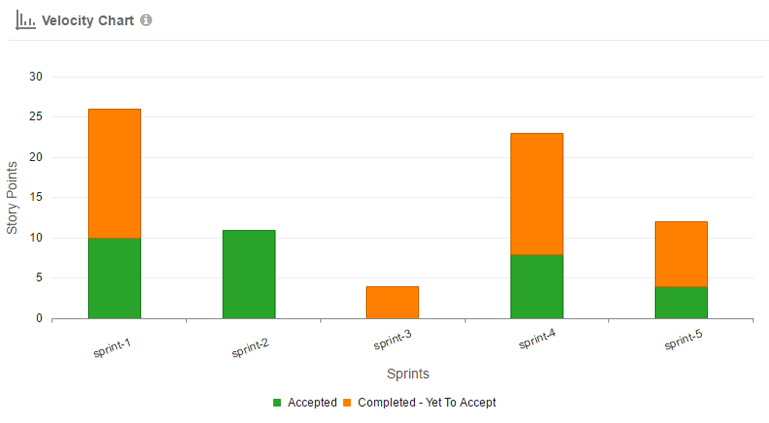
The Velocity Chart shows the amount of value delivered in each sprint, enabling you to predict the amount of work the team can get done in future sprints. Learn more here.
X Axis – shows last 15 completed Sprints within a Project.
Y Axis – Sum (Story points of Accepted User stories) + Sum (Story points of Completed but yet to accept User Stories).
Each bar representing the overall user stories that are accepted and the overall user stories that are completed, with in a completed sprint.