
Sprint Effort Variance represents the comparison of the effort that was planned (Estimated Hours) amongst the actual efforts (Spent Hours) with in a sprint.
X Axis – shows last 15 sprints.
Y Axis – Hours
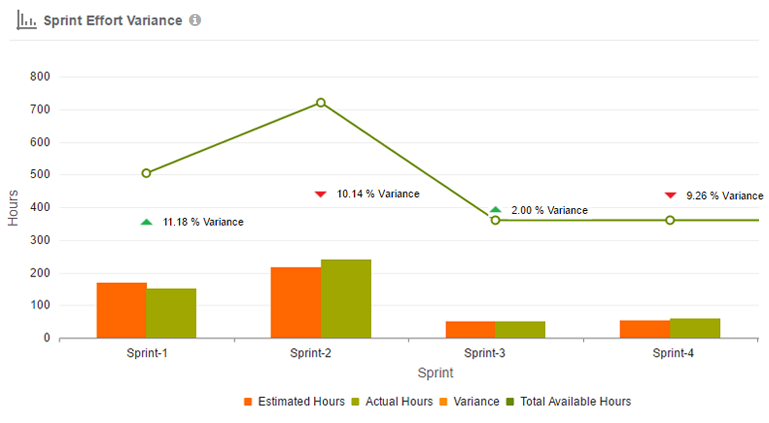
1. If the Spent Hours is less than the Estimated Hours, then Effort Variance will be positive.
2. If the Spent Hours is more than the Estimated Hours, then Effort Variance will be negative.If the Variance is positive then the indicator will be in green and spiked up. If the variance is negative then the indicator will be in red and spiked down.
3. Positive Variance represents that the team member has spent less time (in Hours) in comparison of their Estimation (in Hours) within a sprint.
4. Negative Variance represents that the team member has spent more time (in Hours) in comparison of their Estimation (in Hours) within a sprint.
5. Orange Bar – Total Hours of work estimated by the Team members (in Hours) with in a sprint.
6. Green Bar – Total Hours of time spent by a Team members (in Hours) with in a sprint.
7. Green Trend line – It will show total available hours of all the sprints within a sprint.
8. Variance is based on total hours that are spent more/ less in comparison of your estimated hours.
(Sprint Effort Variance = Estimation Hours – Spent Hours).