ON 15 OCTOBER 2020
Release 3.10
Home ![]() Quickscrum Releases
Quickscrum Releases ![]() 3.10
3.10
Release Overview
- Resource Utilization
- Product Backlog
- Defect Backlog
- Move to other Project
- Workitems Summary by Resolution
- Workitems Summary by Severity
- Workitems Summary by Created By
- Workitems Summary by Assigned By
- Workitems Summary by Priority
- Subitem Completion Heatmap
- Workitem Completion Heatmap
- Timesheet Billable Hours Percentage
- Timesheet Category
- Resource Scheduling & Consolidated Timesheet Pagination
Additionally, we are also enhancing product backlog, defect backlog, release planning and sprint planning. Product backlog and defect backlog are already deployed for the use with extremely high performance and great user experience. We aim to replace all views within next quarter so you can really enjoy using Quickscrum on day to day basis.
Resource Utilization
Resource utilization is a 360° view of your enterprise comparing planned vs actual utilization of resources in terms of hours and full time equivalent (FTE). You can get the comparision at portfolio, project and resource level.
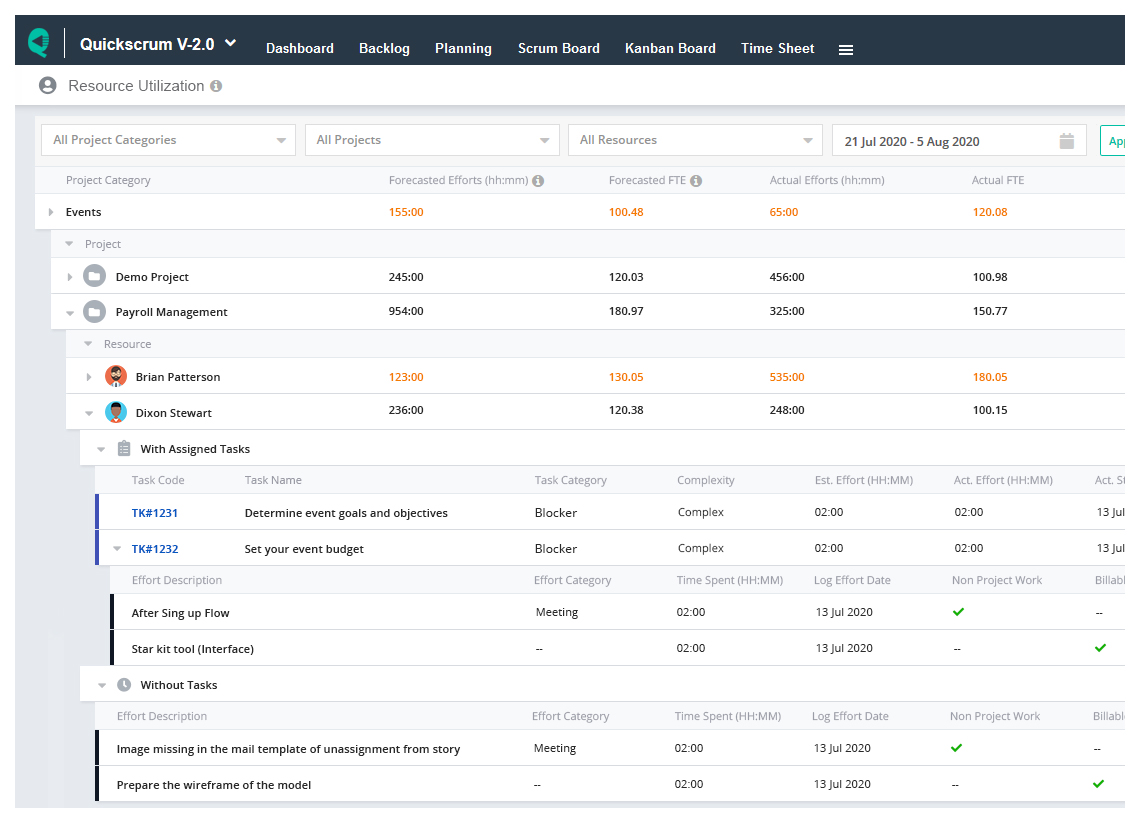
You don’t need to configure anything to generate this view. Make sure that you are authorize to access it. If you are not, please contact your administrator.
Resource utilization is a single view showing four key figures,
- Forecasted Efforts (Scheduled efforts)
- Forecasted FTE (Scheduled FTE)
- Actual Efforts
- Actual FTE
Note: FTE – Full time equivalent. Click here to learn more about FTE.
Resource utilization has four level hierarchy
Level 1 – Portfolio (Project Category)
Level 2 – Project
Level 3 – Resource
Level 4 – Task
Level 5 – Effort
Who can use this view?
- CEO, CTO, COO, CFO
- Portfolio Manager
- Programme Manager
- Anyone leading multiple projects
What key information to derive?
You can get the following key insights for better decision making and bringing a huge impact to your organizations’ profitability.
- Get scheduled vs actual efforts at portfolio, project and resource level to understand whether you are
overspending or underspending compare to planned efforts.
You will come across one of the following real life scenario,
- Scenario 1: Forecasted Efforts < Actual Efforts (Team has spent an additional amount of efforts than the scheduled one)
- i.e. Team has under estimated initial efforts or Project scope is changed later stage of the project.
- Scenario 2: Forecasted Efforts > Actual Efforts (Team has spent less amount of efforts than scheduled one)
- i.e. It shows that either, The management has overallocated resources by wrong estimated efforts required or The team has outperformed for the project completion.
- Get full time equivalent for portfolio, project and resource level.
- Calculate estimated budget vs spent budget for any portfolio or project using total hours or FTE value.
Product Backlog
Absolutely newly designed product backlog with higher performance and better user experience.
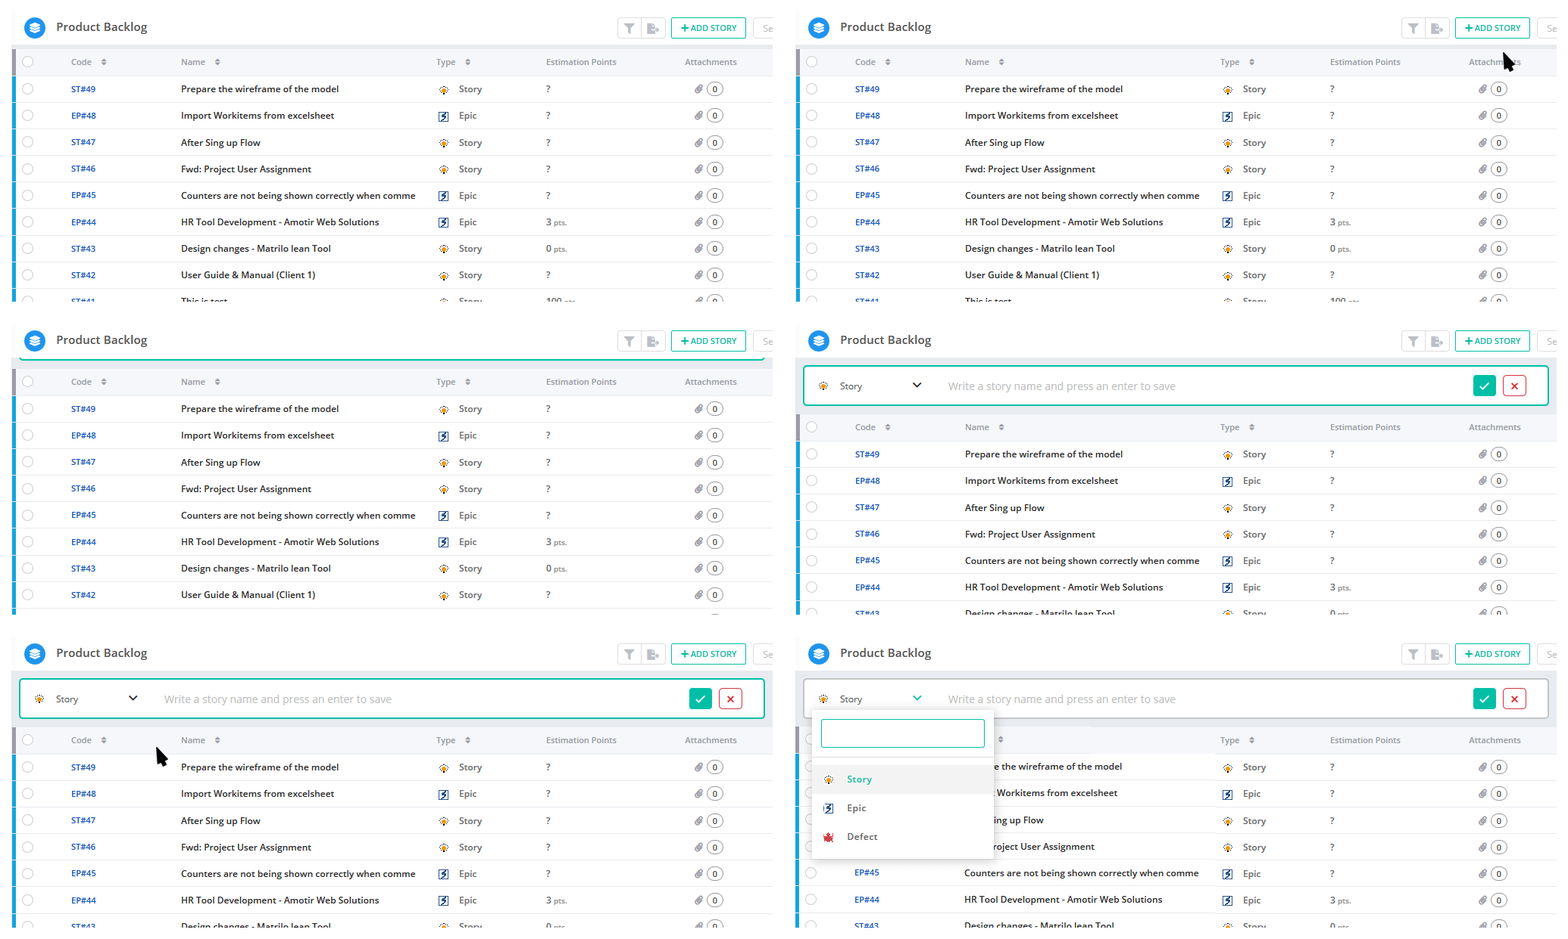
![]() Newly designed quick add
Newly designed quick add
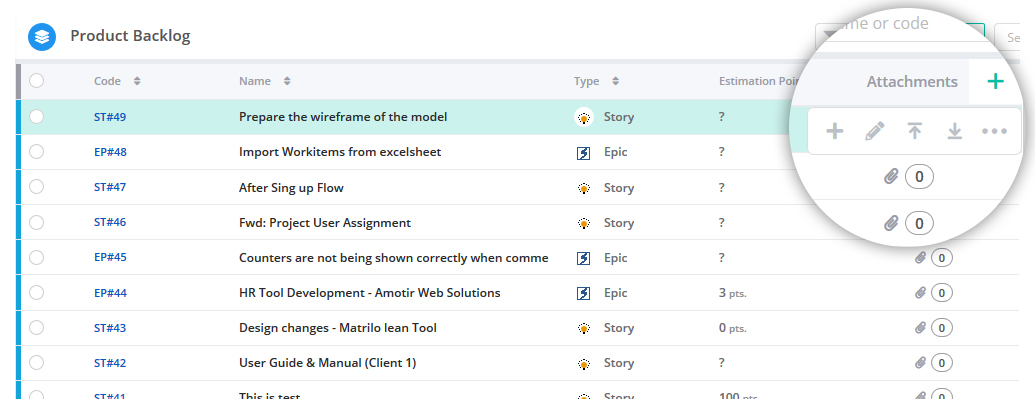
![]() Introducing quick action menu with options such as – add child, edit workitem, move to top, move to bottom & more actions
Introducing quick action menu with options such as – add child, edit workitem, move to top, move to bottom & more actions
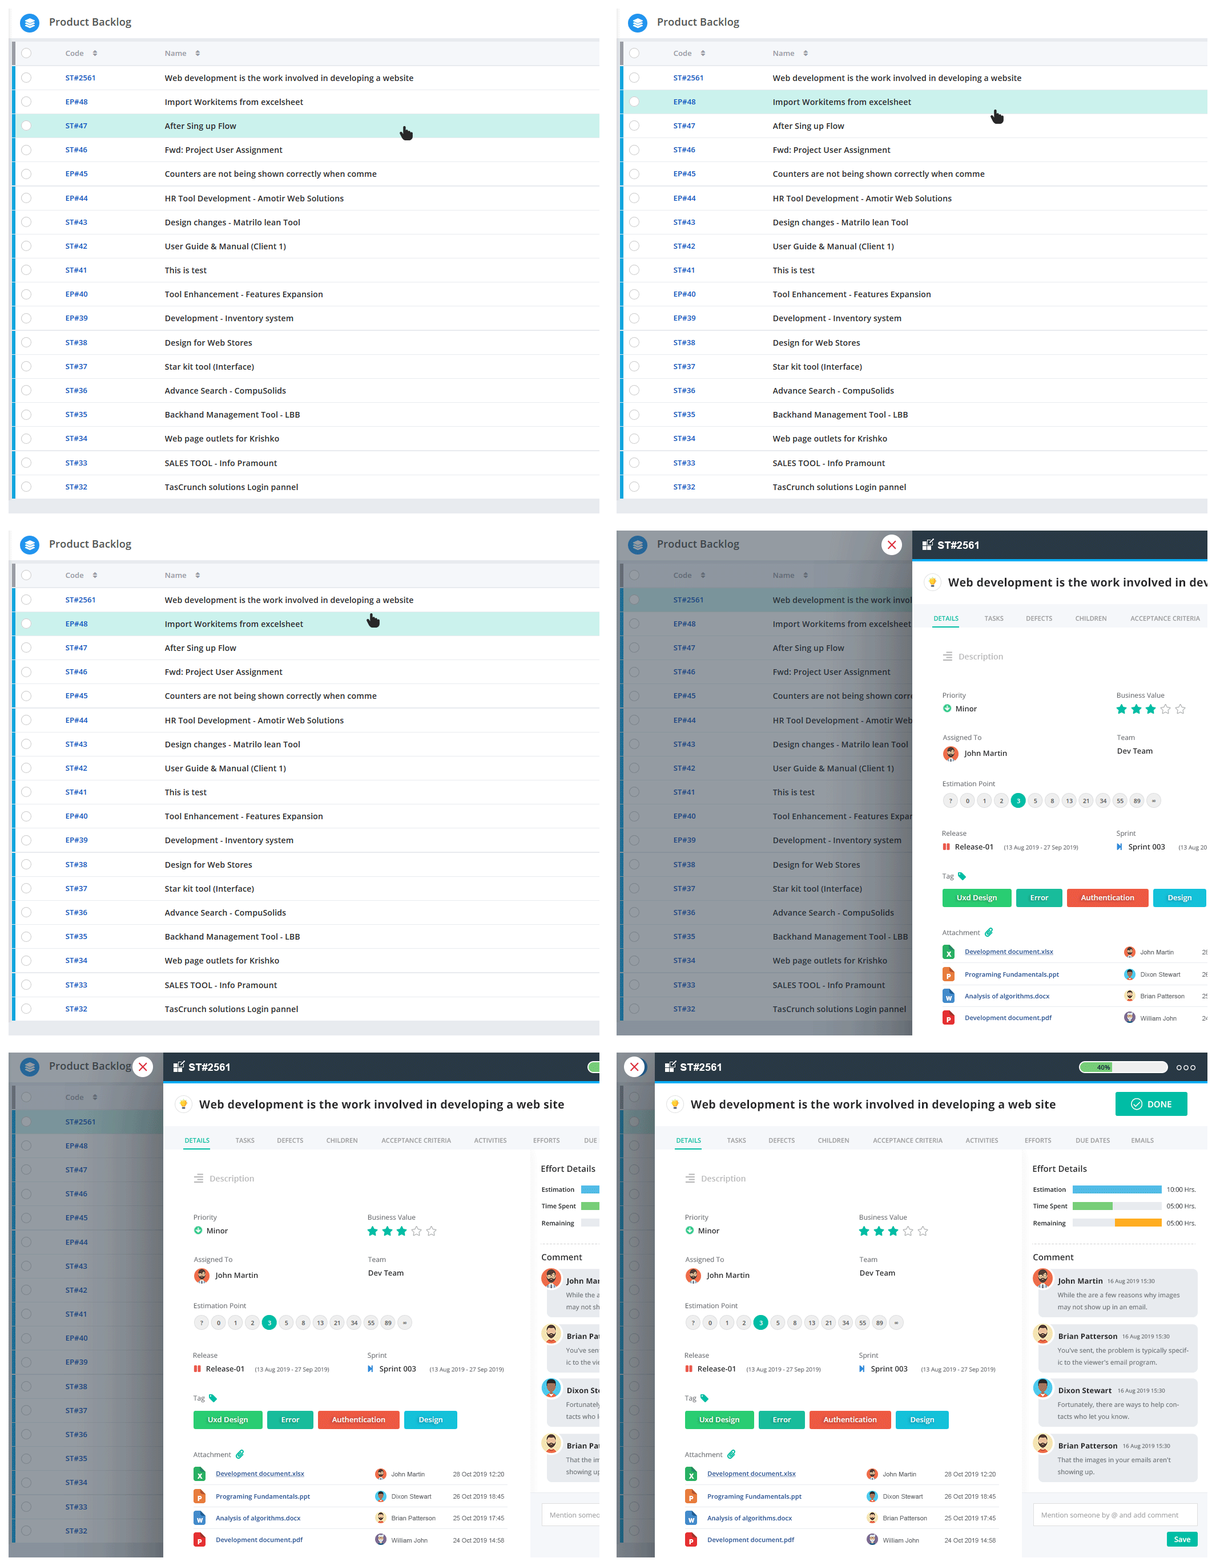
![]() Redesigned popup with high performance
Redesigned popup with high performance
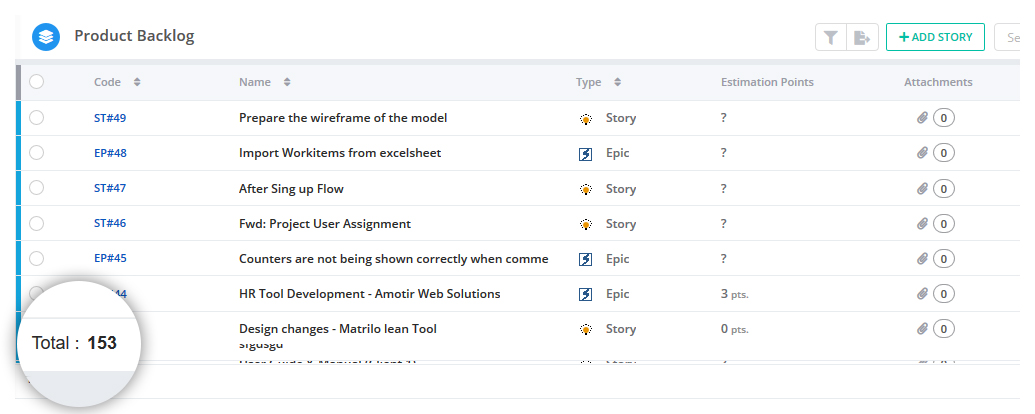
![]() Show total count
Show total count
Defect Backlog
Absolutely newly designed defect backlog with higher performance and better user experience.
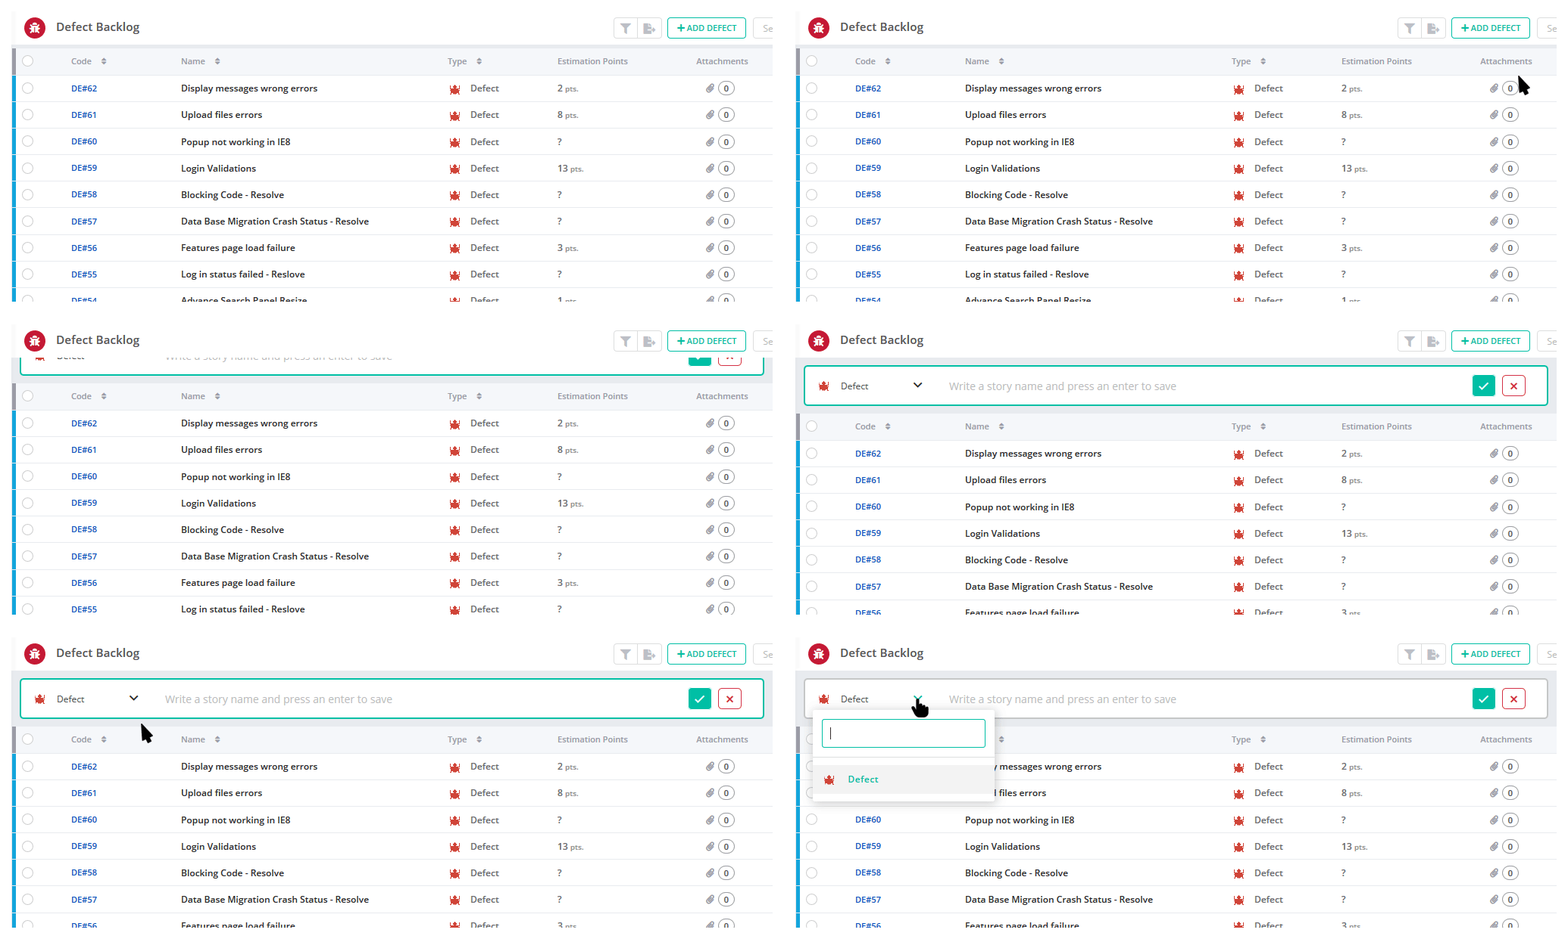
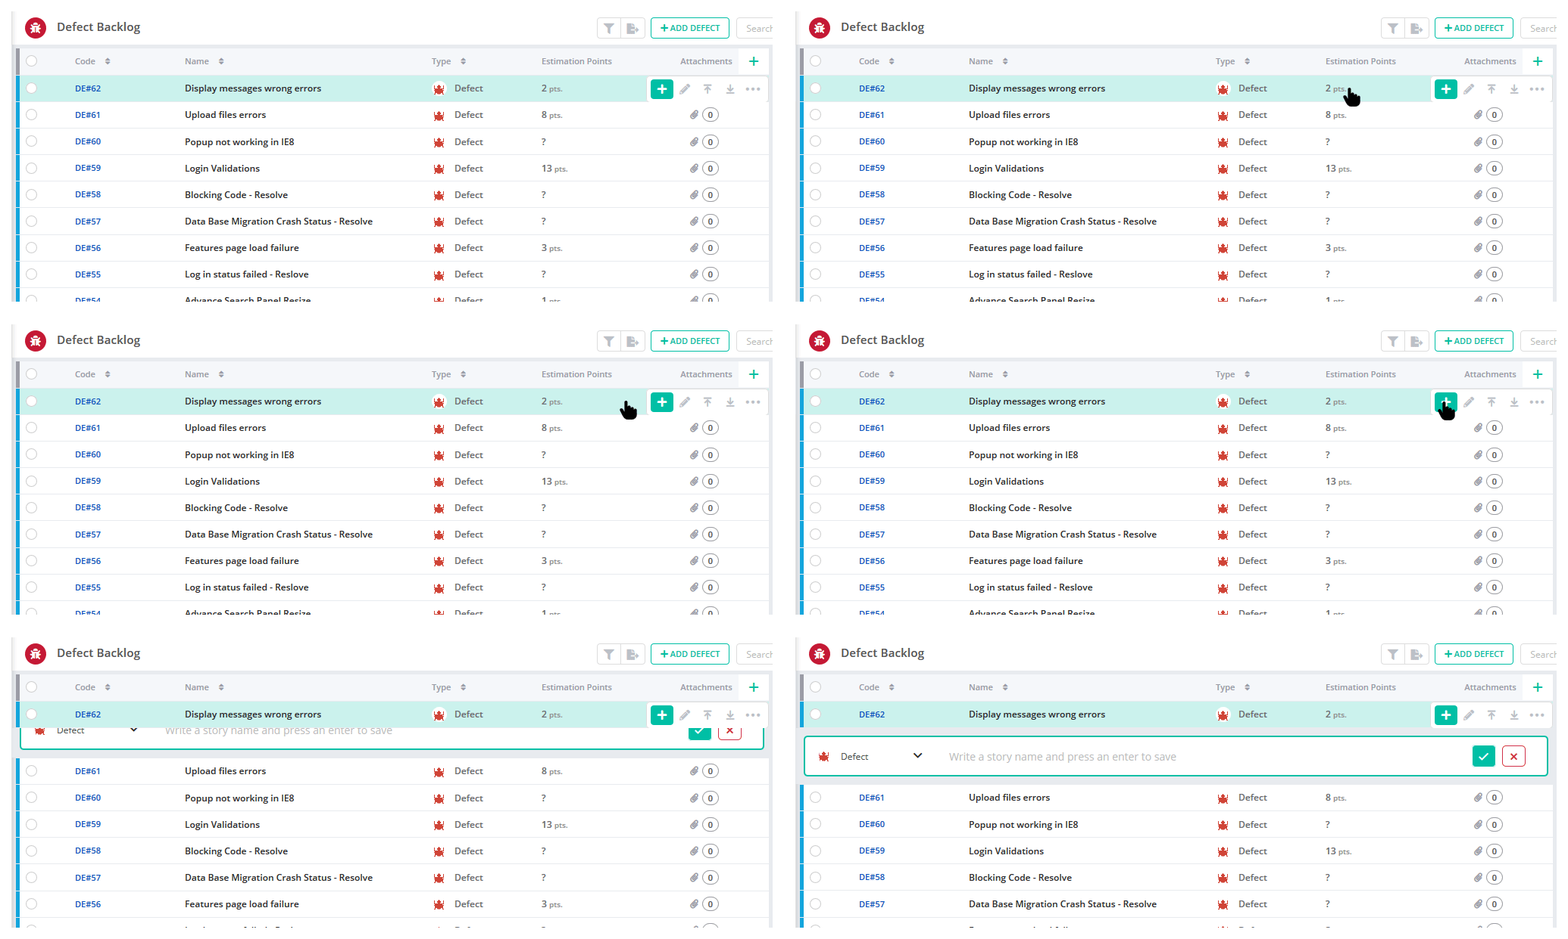
![]() Newly designed quick add
Newly designed quick add
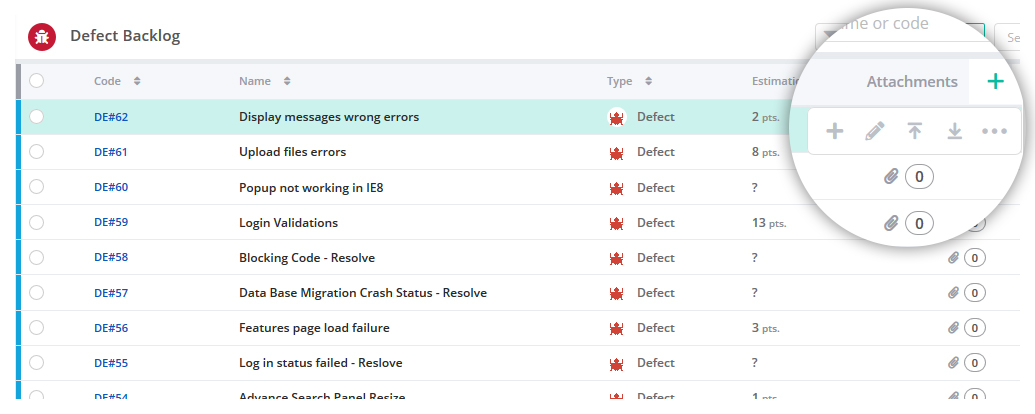
![]() Introducing quick action menu with options such as – add child, edit workitem, move to top, move to bottom & more actions
Introducing quick action menu with options such as – add child, edit workitem, move to top, move to bottom & more actions
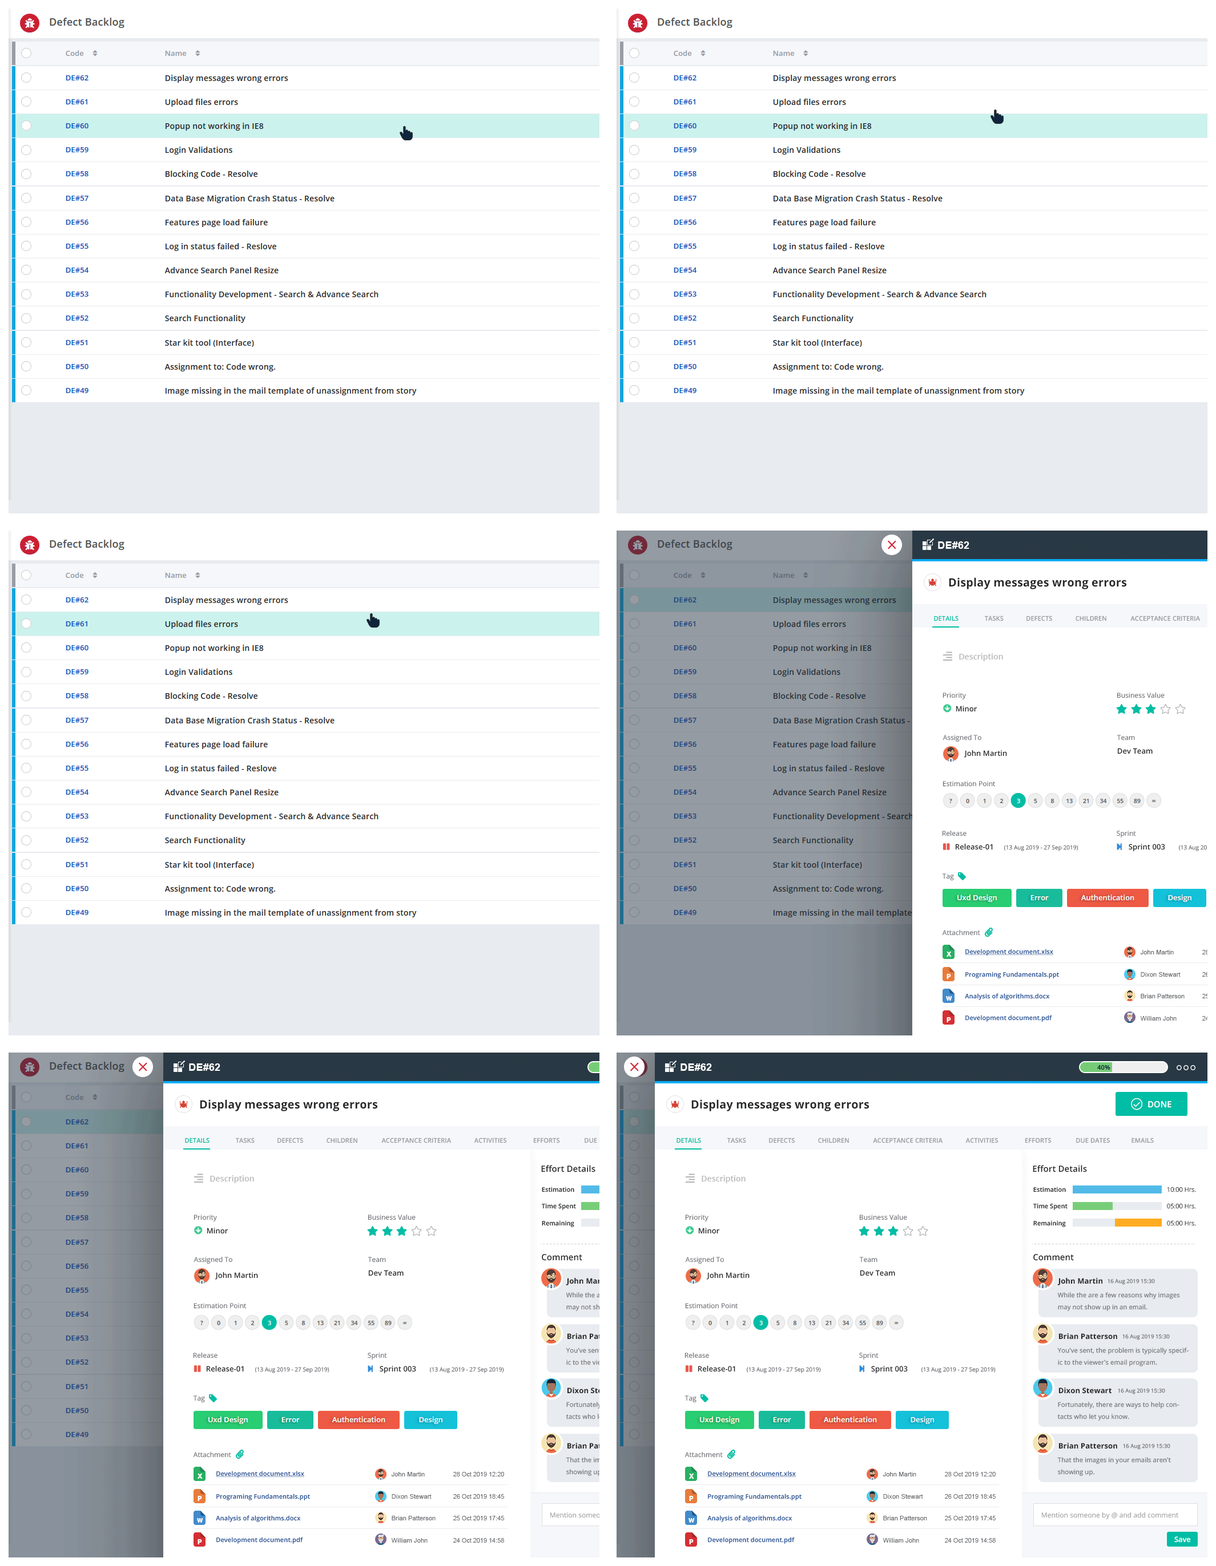
![]() Redesigned popup with high performance
Redesigned popup with high performance
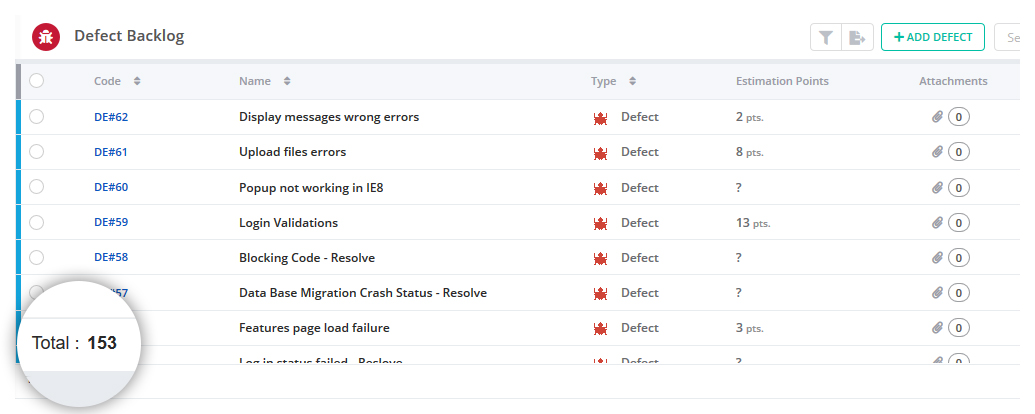
![]() Show total count
Show total count
![]() Added a possibility to split a complex defect into smaller workitems by adding children
Added a possibility to split a complex defect into smaller workitems by adding children
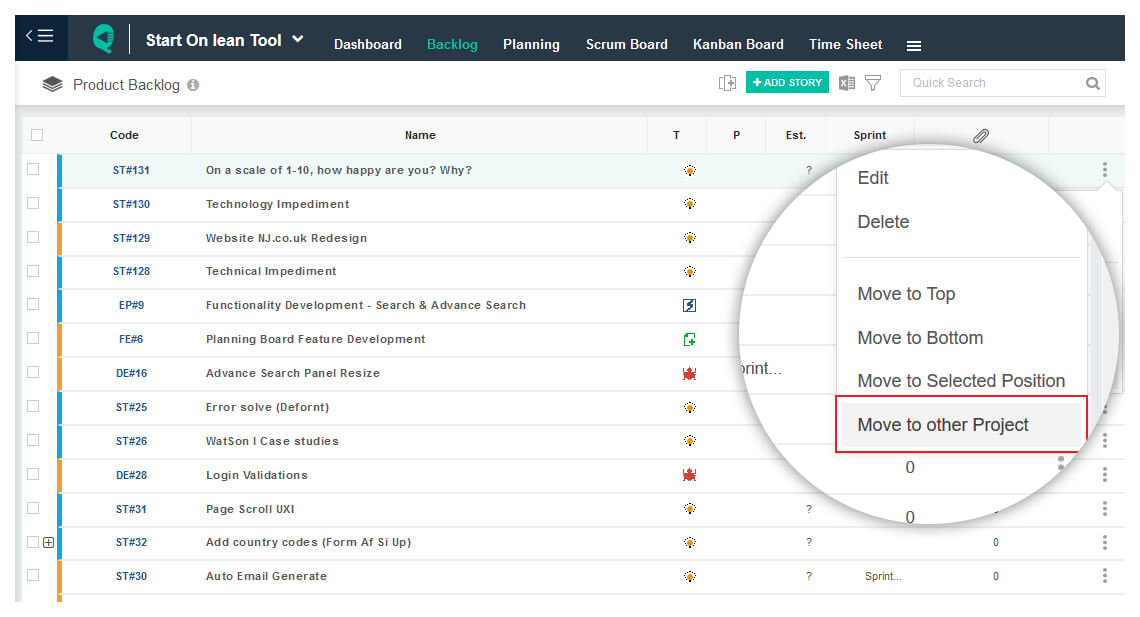
Move to other Project
There are cases when you want to move a userstory from one project to another project. It was not possible earlier. We have introduced a feature “Move to other project” to make it happen.
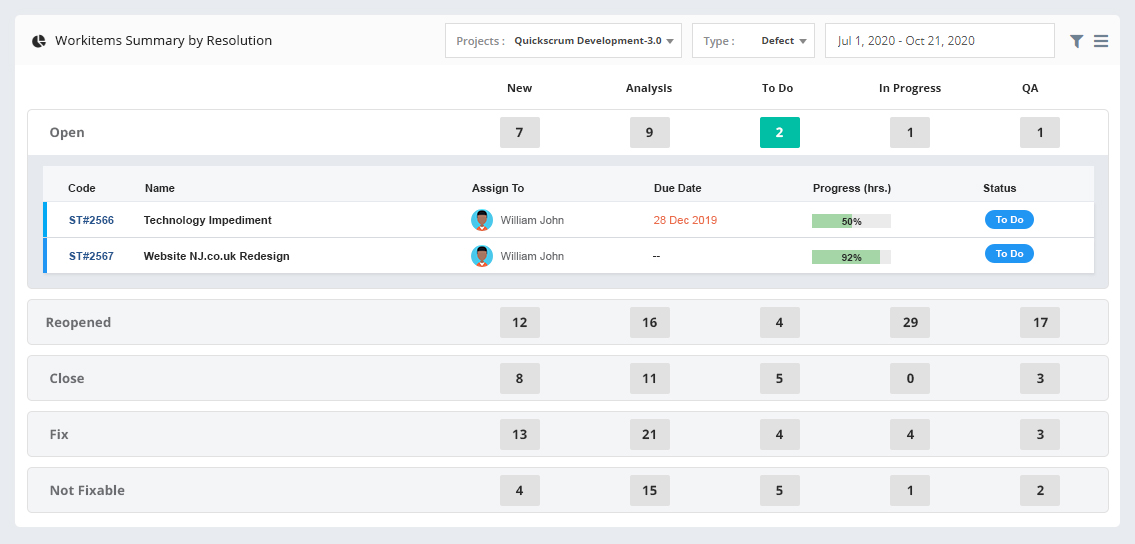
Workitems Summary by Resolution
View total stories within a project group by Resoultion and Status.
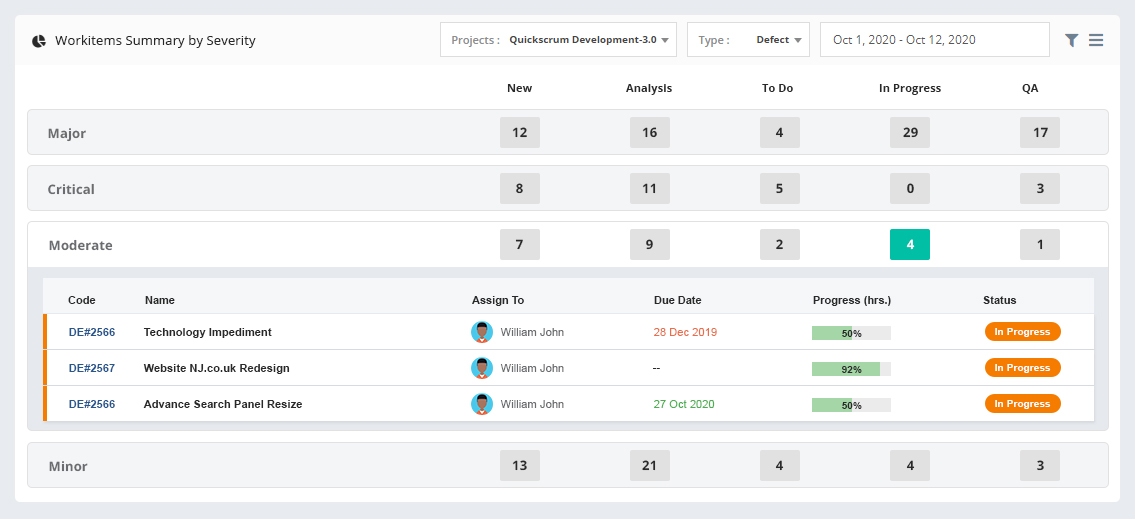
Workitems Summary by Severity
View total stories within a project group by Severity and Status.
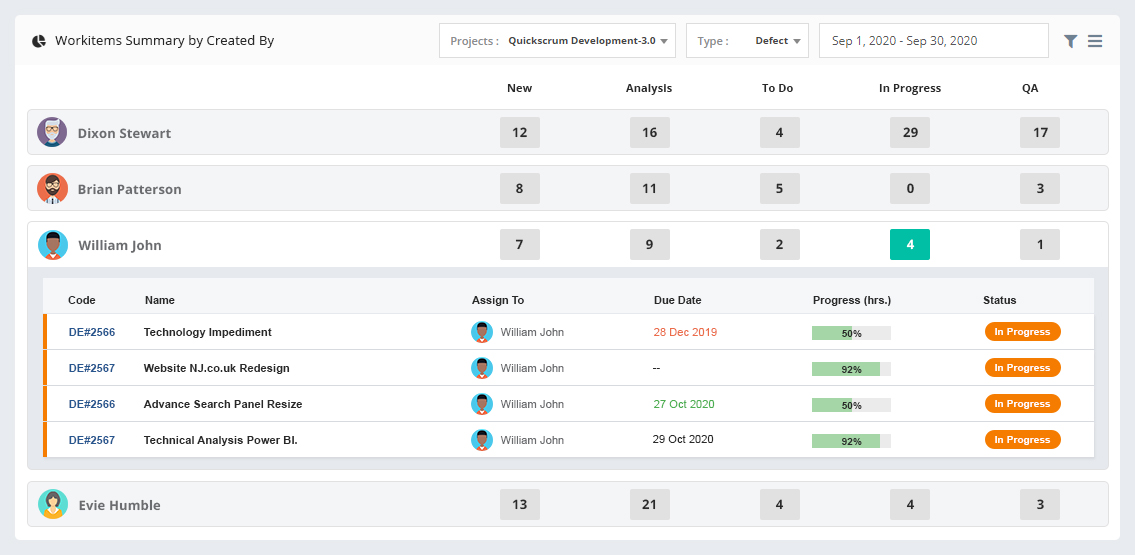
Workitems Summary by Created By
View total stories within a project group by Creator and Status.
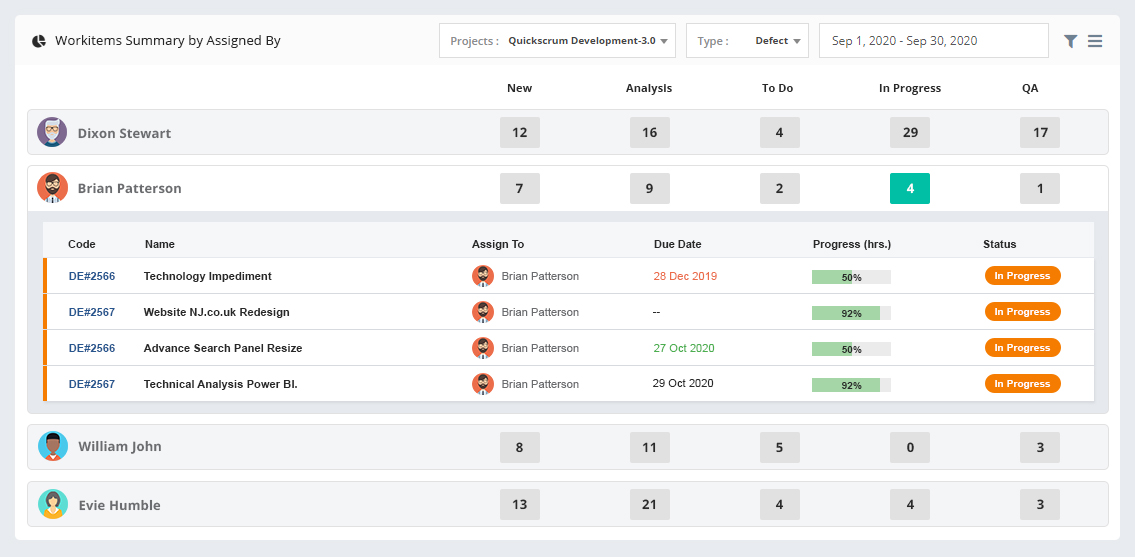
Workitems Summary by Assigned By
View total stories within a project group by Assignee and Status.
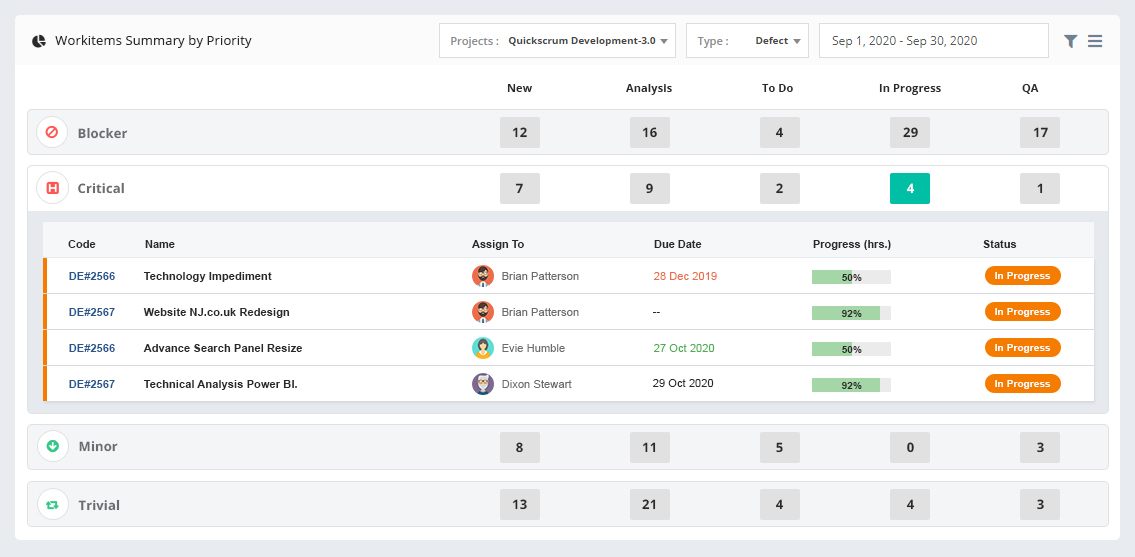
Workitems Summary by Priority
View total stories within a project group by Priority and Status.
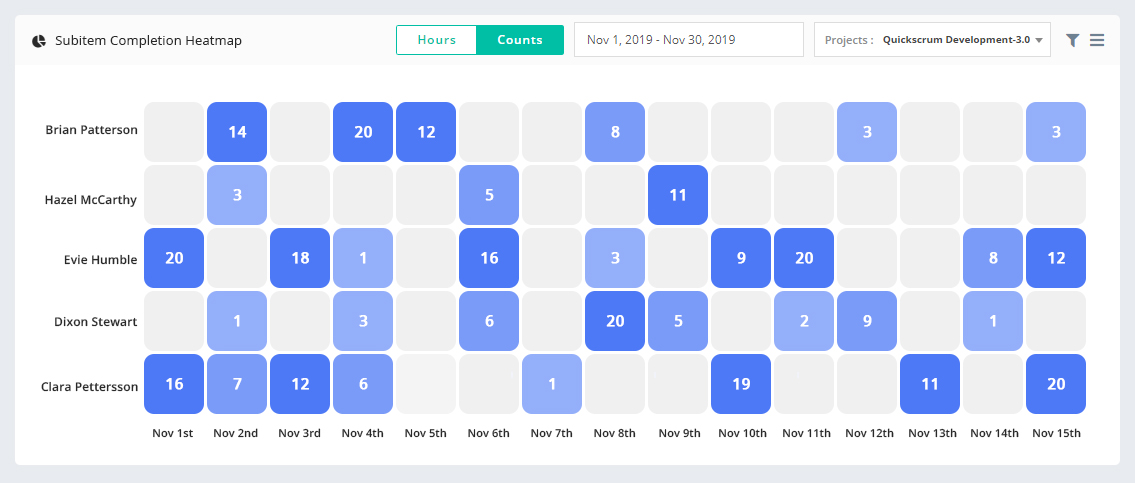
Subitem Completion Heatmap
View subitems completed within a project by team members over the specific duration.
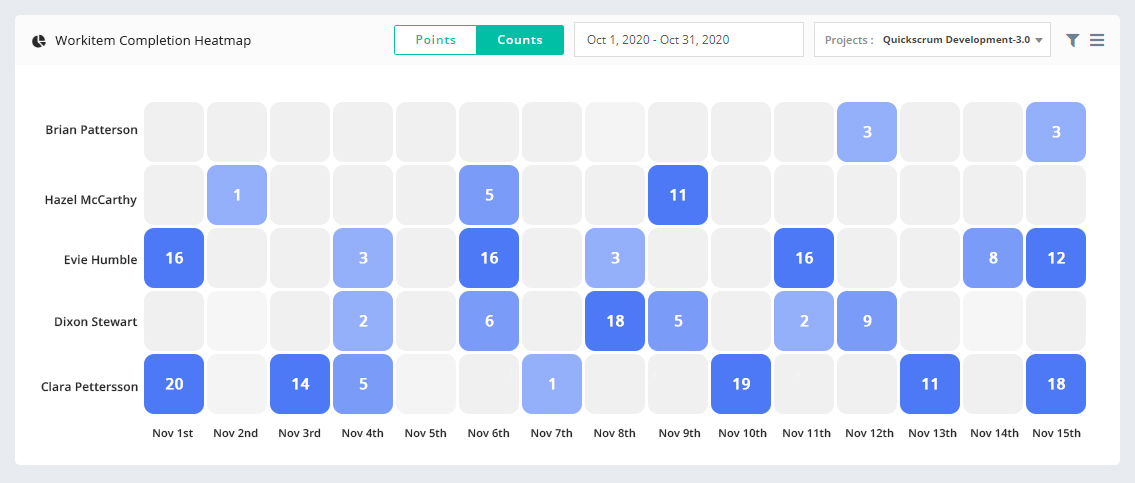
Workitem Completion Heatmap
View workitems completed within a project by team members over the specific duration.
.
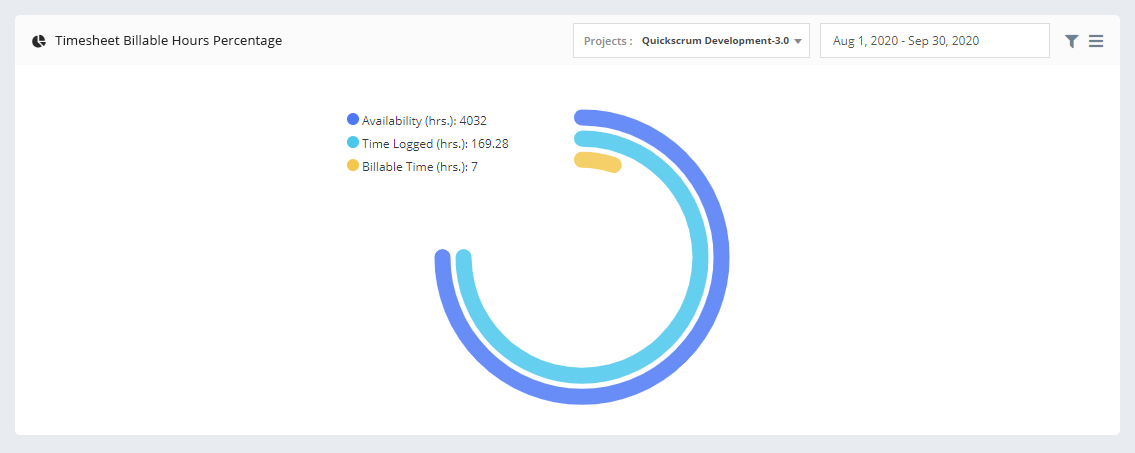
Timesheet Billable Hours Percentage
View billable hours percentage within a project.
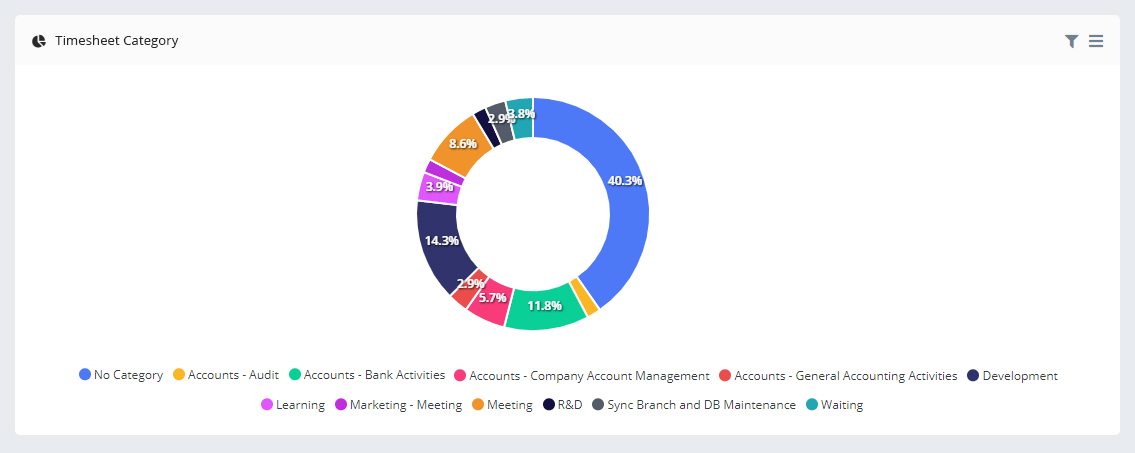
Timesheet Category
View percentage of time spent within each category.
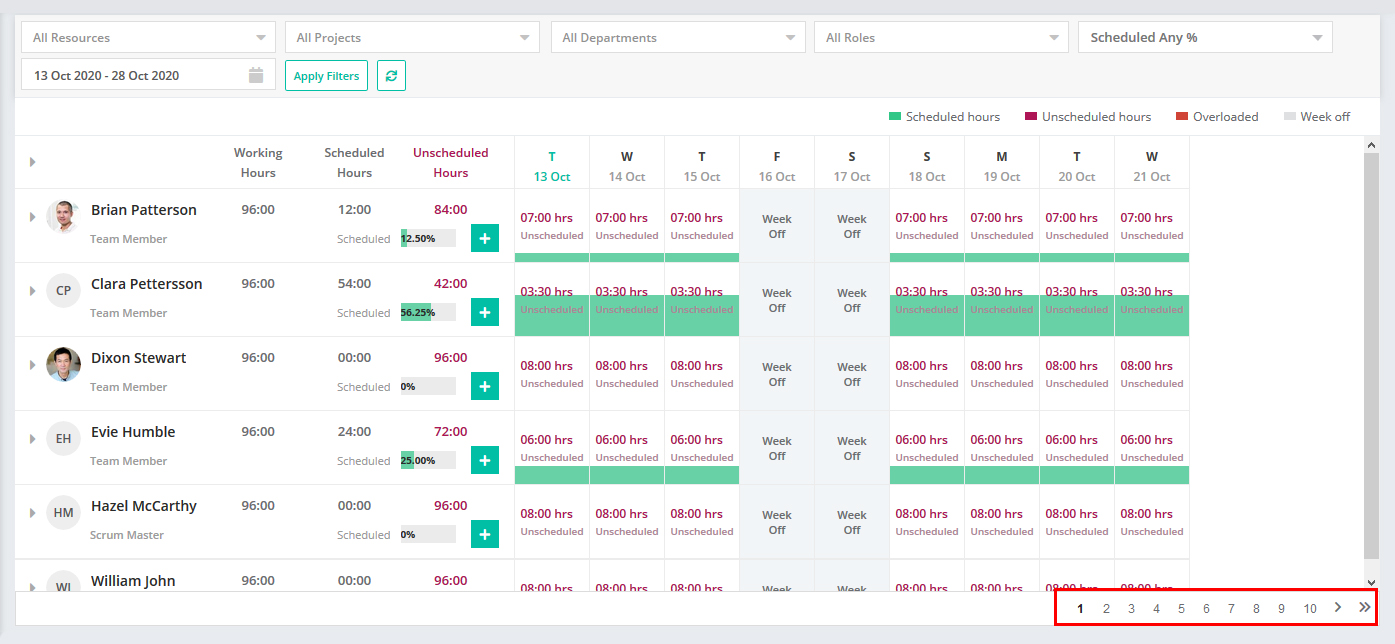
Resource Scheduling & Consolidated Timesheet Pagination
We have changed the behaviour and added pagination in resource scheduling and consolidated timesheet. Few of our clients detected performance issues with resource scheduling and consolidated timesheet due to heavy data. Our team has decided to add pagination instead of loading data on the scroll. This will enhance the overall user experience.
We thank you so much for your valuable feedback, without them it would not be possible to reach the stage we are today. Let us continue to work closely and keep on innovating the greatest product ever designed for the enterprise project execution & management.
We are working on many exciting enhancements to strengthen your internal processes and speed up your project deliveries.
Good luck and stay safe ![]()
Regards
Team Quickscrum

Do you want to implement the best practices?
Schedule a free call with our Customer Success Manager to Implement the Best Practices