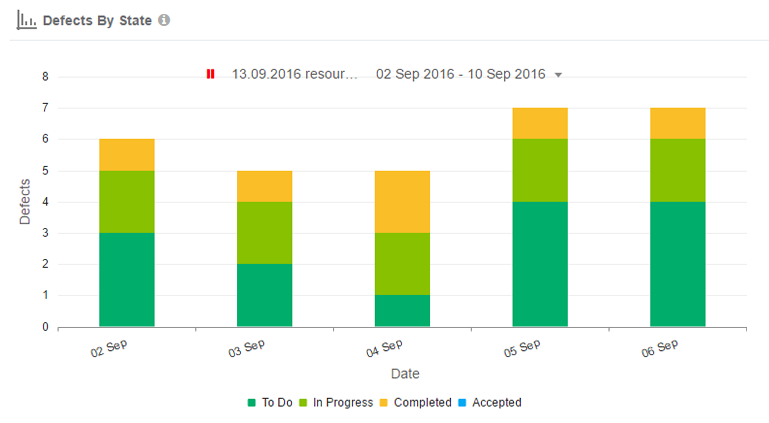
The Defects by State shows all open defects (not accepted or rejected) by its state per day over selected time box. The chart takes the sprint as its time box. This chart can be generated for an Individual team or for All Team.
X – Axis: Days of Time Box
Y – Axis: Number of Defects by State in Stacked manner
The decrease or increase in a trend shows the arrival or killing rate of the defects by each day.
Each stacks represents all the defect stories within its status; i.e. To Do, In Progress, Completed and Accepted.

